Before and After
A recent customer lean test is displayed below. Data from both before and after installation of GAMIjector® fuel injectors.
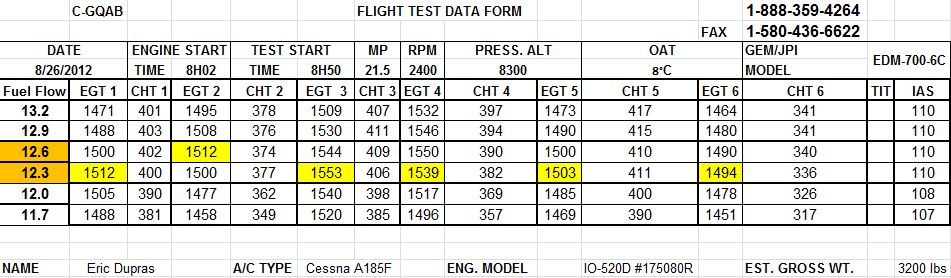
The spread has come down from 0.9 g/h to 0.3 g/h. All cylinders except #2 peak together. I can now run my engine WOTLOP confidently and save 3.5 g/h of fuel and run with much cooler CHT, about 60-70 degrees less. This all amounts to a saving of roughly $35 an hour here in Canada as the price of AVGAS is close to $10/gal and not taking into account preventing costly wear and tear on my engine.
Needless to say I am very satisfied. I doubt we could do better but let me know if you think #2 can be synchronized with all the others.
Thanks again for developing such a great product. I believe it is the most useful and cost effective STC on the market.
Before GAMIjector® fuel injectors: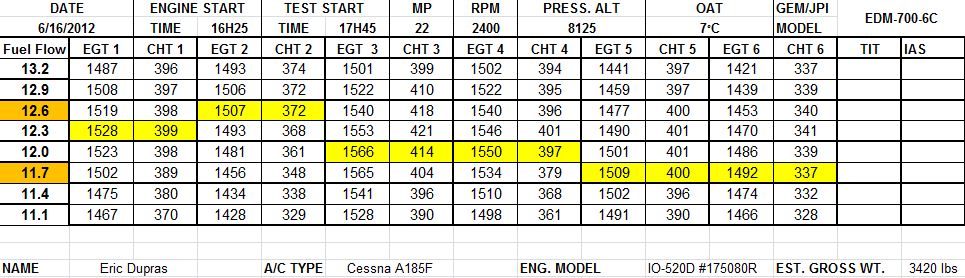
(Please click the images to enlarge)
Following are some graphs that were produced from "in-flight" data. The charts compare engine performance both with and without GAMIjector® fuel injectors. Please note that all of the graphs will enlarge for easier comparison.
Compare the graphs on the left to the graphs on the right:
You don't fully understand your engine until you fully understand these graphs: